The Game of Investing, Vol. 16
- Real Vision
- August 15, 2023

This Week…
We’re back for Part 2 of our lesson on the business cycle with Real Vision co-founder and CEO, Raoul Pal.
In Part 1, Raoul schooled us on the secular trends that drive economic growth, how to spot long-term secular opportunities, and the “magic formula” that drives GDP.
In this issue, we’ll cover 3 things:
- Measuring the business cycle
- A powerful new secular regime driving markets
- Unlocking the new-look business cycle for investors
Welcome to the Game
Welcome to The Game of Investing, a bi-weekly newsletter bringing you “aha” moments and actionable lessons from Real Vision experts. No matter your level of expertise, markets are tough — which is why we all have to put in the work. Ultimately, the game of investing is a competition with yourself. Our mission is to help you navigate the path to success. Prepare to level up.
Let’s get started.
LEVEL 1 — Raoul’s Favorite Tool
Simply defined, the business cycle is merely a series of economic expansions and contractions. Economies never move in a straight line — they ebb and flow… That’s the business cycle.
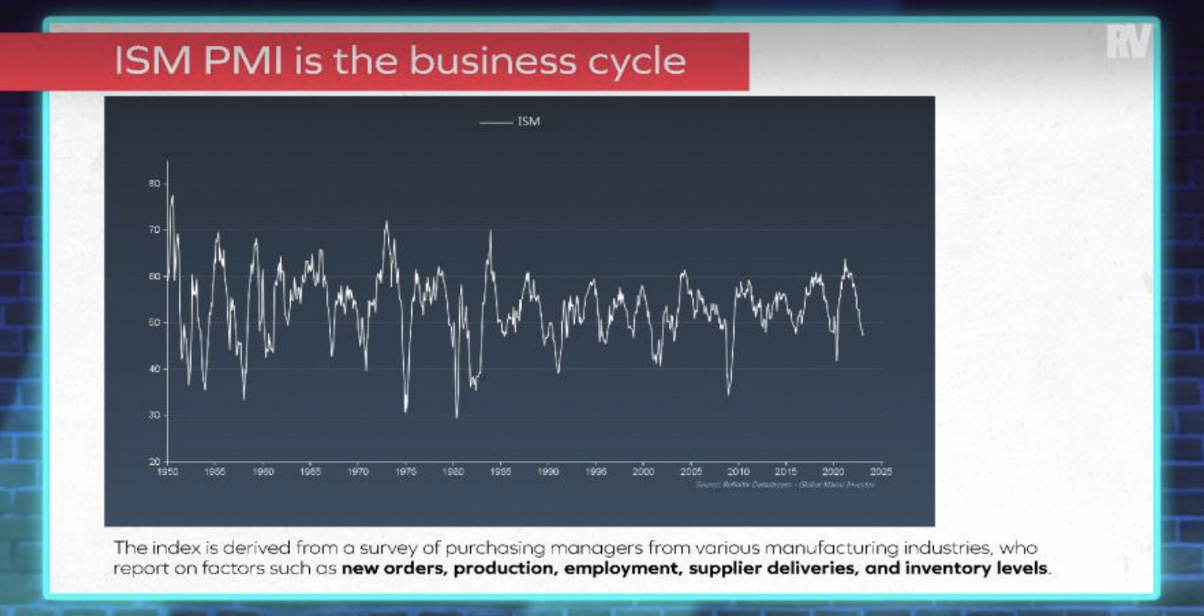
Raoul’s favorite leading indicator for judging the ebbs and flows of the business cycle is the ISM purchasing mangers’ index (PMI) — a monthly survey of purchasing managers’ expectations of things like new orders, employment, and inventories.
- “It’s an oscillator — it goes up and down — just like GDP,” says Raoul. “Once you start peeking out, there’s a 100% chance it will come lower over time.”
The economy will slow down when ISM begins rolling over, but the trick is getting the timing right.

“ISM leads the economy by about a month,” says Raoul. “But it’s not just the economy — it’s every asset.”
Since asset prices reflect the value of underlying companies (stocks), debt (bonds), or hard assets (commodities, real estate, etc.), the business cycle typically drives the performance of all asset classes over the medium-term (6-18 months).
- That’s essential to understanding proper asset allocation and risk management.
But here’s the catch. As Raoul has been covering extensively at Real Vision and GMI, the business cycle has recently evolved…
Intermission

Here at Real Vision, we’re on a mission to help people profit from knowledge — giving everyone unparalleled access to the very best insights and analysis from the most respected names in finance & web3.
What we also do is connect people — with each other, with our guests, and with partners whose services bring value to our community.
If you want to reach this highly engaged, action-oriented audience on our shows and in our newsletters, connect with our partnerships team today at partnerships@realvision.com.
LEVEL 2 — The QE Regime
The U.S. (and global) economy is no longer following a classic business cycle. Rather, it’s following a credit cycle driven by quantitative easing (QE).
- After the Great Financial Crisis, global central banks began a new secular trend of using QE to stimulate economies.
- During the COVID pandemic, QE was used more aggressively than ever before, and Raoul believes this solidified the dependent relationship between asset prices and global liquidity.
“What they did was debase the currency,” he explains. “Now, you can track G5 central bank balance sheets and during times of expansion, asset prices go up. During times of contraction, assets go down. It’s perfect.”
Level 3 — Predicting the New Business Cycle
The way Raoul see it, the game has clearly changed — and there’s no going back. When global liquidity (driven by central bank balance sheets) expands, assets follow suit.
And remember ISM? Well, Raoul matched up the charts and found a perfect 3.5-year correlation between ISM cycles and central bank liquidity.
- Every 3.5 years, according to Raoul, the Fed expands its balance sheet in order to pay down debt.
- This newfound liquidity (QE) pumps into markets and sparks the next recovery phase of the business cycle.
Armed with what he believes is a leading indicator for ISM, Raoul can more accurately predict where the economy — and asset prices — are headed in a given time frame.
And thats’ really the only trick.
Before You Go: If you’re interested in watching the entire 3-part course, Investing with the Business Cycle, featuring Raoul, Andreas Steno Larsen, and Julien Bittel, you’re in luck.
This series is available for Real Vision Plus members and higher. Find out more about Plus and the Real Vision Academy right here.
Next Time
Thanks for reading. In our next issue, we’ll look at the macro data that matters most for investors — and how you can become a macro master.
See you then.
Have feedback on The Game of Investing? We’d love to hear it. Just email us at essential@realvision.com to share your thoughts.
The Game of Investing Newsletter…
…a bi-weekly newsletter where you learn from investing pros about how this game actually works.
Because learning about finance shouldn’t be boring.


